Thursday 24 September 2015

Road to Success – Journey to Financial Freedom

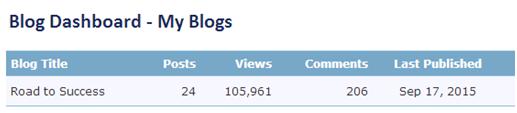
I started to write on 11st August 2015. So far, I had shared 24 articles within 1 and a half month. Thanks everyone for the comments, either it is good or bad. I hope you are able to gain something from my articles. I am still in the process of learning as well. Just to share something about myself.

I was born in year 1992, age 23. I completed my degree in Actuarial Science on year 2014.

During the first 2 years of my degree, my life was just playing games, futsal and “yamcha” with friends. I don’t have a direction where should I go after graduate. However, along the third year, I slowly found my interest and dream.

In my degree life, I learnt business finance, portfolio management, financial statement analysis, micro macro economics and financial economics. However, everything is just in theory and without any real life explanation and practical. Every examination and tutorial is just spoon feeding with all the information, all I need to do is put in the formula to get the answer. Sometimes I don’t even understand what it stands for even though I get the correct answer.

The course did not teach me any real life knowledge about shares market. I don’t even know how to read the economy part in a newspaper.  Luckily, I get my first investment book which the author was Cold Eye. From there, I started to absorb and gain knowledge about Malaysia shares market.

When I first know there were 900+ listed companies in Malaysia market, I was shocked. Where am I supposed to start? Which segment should I focus on? And, even though I understand the knowledge of PE, ROE, NCAV, NTA, current ratio, debt ratio, etc., where should I find all the information that I need to calculate?
GOOGLE was my best mentor during the hard time. I slowly develop my own excel sheet and a list of shares which I had studied before. From every company research, I gain new knowledge. From there, I improved and refined my works from time to time. However, it is impossible for me to study one by one. I need a team or group to do this together. I tried to influence my friends to join me, unfortunately no one is interested.

Even though I am alone, I am still continuing with my research. I tried my best to cover as many as I can. I take it as my hobby where I am happy to do it. By the time I am ready to step into real life investment, I realize I had not much money to invest as I just graduate. In fact, I still have huge PTPTN loan to return!

I started my shares investment journey only by end of February 2015. During that time, it was the recovery period of shares market. I am doing well in my first portfolio. I am very keen to stick with Cold Eye and Warren Buffet theory, which is to hold for long term. However, I failed.

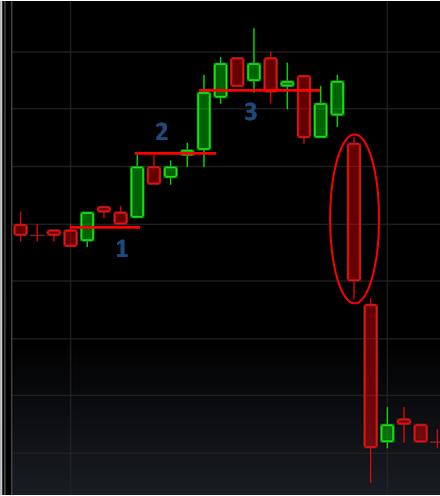
I remember when I first bought Homeritz at MYR0.99, it took 1 to 2 months for it to up to MYR1.20 and then it only took 1 to 2 weeks to drop back to MYR0.96! I keep asking myself why don’t I take profit when the price was still MYR1.20. I had wasted 2 months holding for nothing.  On the other hand, I saw people flying Wintoni during that time. In 2, 3 days, they had gained more than 20%! It was so attractive! At last, I was influenced and changed my concept which leads to lose trade more than win trade.

I learned and I gained along the journey. I am glad I experienced the downtrend during this moment. Even though I loss part of my money, but I believe it will make me a better, stronger and more experienced investor. A good analyst doesn’t mean he/she is a good investor. At least I found my own method and strategy of holding now.

However, as time pass I realize I need a team to do it together. I don’t have anyone to discuss with or point out my mistake. One person can walk very fast along the journey, but without a team I will not be able to walk too far. So, I started to write and share some articles.

It is never easy to start from nothing until I had something today. Look back at the past 1.5 years journey, I am glad for who am I today. And, my journey had just started! This journey will be a long one, but I believe I can walk till the end.
You are never too old to set another goal or to dream a new dream. The time for action is now and it's never too late to do something. The opportunity only waits for person who is ready! We will be success, not immediately, but definitely!

One day, I will achieve financial freedom through shares investment, by the age of 45. One day, I will set up my own company which principally involve in research, analysis, education and fund management.
Thanks for all the comments either it is good or bad. Thanks for all the support words; indeed it gives me motivation and boasts up my passion. I will continue writing and learning!


I will be writing some stock analysis report to earn some pocket money. It will be a step nearer to my dream. I will be seriously happy if some of you willing to support me.

I will be writing 5 stock analysis reports and 1 comparison of same industry company report a month for a fee of MYR120/month. I believe I can bring out something that normally financial institution equity analyst will not write and notice. It will be a simple, easy to read and understandable report. It had included fundamental and also technical analysis.

You may download a sample report of SAM Engineering as below:

You may also refer some of my articles as below:
1. Export-Oriented Company Not Necessarily Benefit From Weakening Of MYR  -->Tongher 
2. How to Spot Unfavourable Factors of a Company? -->AYS
3. Consistently Profit Making Company Not Necessarily Is Good --> London Biscuit
4. The Art Of Investing – How To Survive During Market Downturn

In addition, you may request to carry out a research on a specific company that you wish to know, for a fee of MYR25/report. For those who subscribe monthly, there will be no extra charges.

For those who are interested, you may contact me at richeho_92@hotmail.com or 016-9392726. Or you may leave your email below, so that I can contact you.

Just for sharing :)

Tuesday 22 September 2015

What Is The Potential High Return Stocks?

Most people like to ask, what stocks are able to give a high return in short period?

As an investor, I can’t answer you on this but I can tell you what type of company you should focus on - company that acquired another profit making business.

Acquisition is a corporate action in which a company buys most or all of the target company's ownership stakes in order to assume control of the target firm. Acquisitions are often made as part of a company's growth strategy whereby it is more beneficial to take over an existing firm's operations. Acquisitions are often paid in cash, the acquiring company's stock or a combination of both.

What is the effect of business acquistion to a company? How powerful is an acquisition?

I would like to share about two examples.

Inari Amertron Berhad was formed following the merger and acquisition of two EMS providers: Inari Berhad and Amertron Limited.
The following is the annual result for Amertron Group before acquired by Inari. Based on three year average, Amertron was able to achieve USD4m profit after tax, which is equivalent to MYR12.7m (USDMYR = 1 : 3.18) during that time. 

That’s mean if Inari successfully acquire 100% of Amertron, they will take all its net profit into account in the next financial year! With an additional of MYR12m+ a year, definitely Inari financial result will fly! Let’s have a look at Inari financial result before and after acquistion.

Before
After

Basically, Inari net profit had increased 400% in addition with the robust of the industry!

Furthermore, don’t forget the acquisition is only costs USD32m! With only USD32m, Inari can make extra USD4m a year! The PE ratio for this acquisition was only 8!

The below is the price chart of Inari. Its price went from MYR0.40 to MYR3.30 today, 700+% increase over the 3 years! This is crazy.

Another example is SKP Resources (“SKPRES”). On 2014, SKP acquired whole three subsidiaries under Tecnic Group Berhad.
The cost of this acquisition was MYR200m!

TECNIC net profit on FY14 was MYR19.5m, that’s mean SKPRES will have additional MYR19.5m net profit taken into its financial result after acquisition! The PE for this acquisition is 10.20, still acceptable.

The net profit of TECNIC was only taken into account on FY15. As above, SKPRES’s revenue and net profit had increased significantly.

Have a look with SKPRES price chart as well. After the acquisition, its price moved up from MYR0.70 to current MYR1.40, equivalent to 100% gain in less than a year! 
From the two examples above, it proved that acquisition of certain profit making company will lead the company to a new milestone. In term of its price and financial result, both also will go to a new high level.  Definitely, this is the company that we need to focus on and catch.

All you need to do is to carry out some simple homework by reading its circular. If you willing to spend some time to understand some important details, with this small effort and knowledge, you might easily earn up to 2-3x return!

So, what will be the next potential company that probably carries out the same things? Which will be the next Inari and SKPRES?
This? The rest I will leave it for you to study.

Just for sharing.

Monday 21 September 2015

How To Pick A Stock Before Putting Your Money In?

It may seem like you should do your homework before putting all your cash in a company's stock, but in fact many people don't. With that in mind, here are some questions investors should ask -- and answer -- before buying a stock.

Of course, knowing all the answers doesn't guarantee a winning stock. Nothing can do that. But over the long haul, taking the time to consider these questions will make one a better, more well-informed investor.

I will carry out an illustration by using ECS ICT Berhad as example.

1. What Does the Company Do?
Before invest in a company, we need to know what is the business about.  As a shareholder, I think we had the obligation to understand the business nature.
ECS was principally involved in

  • Distribution of ICT products
  • Enterprise systems
  • Provision of ICT services.
ECS business activities lie predominantly in the distribution of ICT products and enterprise systems. They purchase ICT hardware and software from multiple international leading ICT principals such as HP, Cisco and Microsoft, and distribute them to resellers which typically comprises of system integrators, corporate dealers and retailers. Some examples of common products includes servers, PCs, notebooks, printers, scanners, wireless products, LCD monitors, operating systems, system management tools and ICT security products.

2. Is The Business Sustainable in Future?

We definitely need to make sure it is not sunset business. It must be sustainable in future. For example, if the company business is related to films and frame, I surely will not invest in it.

Exports and Imports of Telecommunication, Computer and Information Services in Malaysia
Distribution and Growth Rates of ICT Services by Sub-sectors in Malaysia: 2000-2015
As we can see on the above, ICT industry is growing rapidly in the past 10 year. The continuous advancement of technology brings about frequent hardware and software improvements as well as the introduction of new technologies. So, ICT industry is expected to continue expand and grow in the next few years, either with fast pace or slow pace. The number of international ICT brands in Malaysia market will also grow in line.

3. Is the Company Profitable?

Investors can read the quarterly and annual earnings reports to check out how much net income the company reported and in per-share earnings.
REVENUE RM'000
FY/Quarter
2011
2012
2013
2014
2015
1
278,902
305,387
320,335
357,719
522,855
2
312,149
309,259
300,463
389,916
418,790
3
317,866
327,937
344,192
392,011

4
341,770
333,537
361,276
451,471

TOTAL
1,250,687
1,276,120
1,326,266
1,591,117
941,645


NET PROFIT RM'000
FY/Quarter
2011
2012
2013
2014
2015
1
7,026
8,101
6,381
4,785
9,389
2
5,606
5,615
5,498
7,515
8,001
3
7,051
6,537
5,281
7,282

4
10,460
9,611
9,728
9,850

TOTAL
30,143
29,864
26,888
29,432
17,390
ECS has a history of steady earnings growth. In first two quarter of FY15, its revenue and net profit are greater compared to the past 4 year.

4. How Clean Is the Company's Balance Sheet?

An investors need to be able to read over a company's balance sheet. Is the company saddled with a huge amount of debt compared with how much it earns? Checking out a company's earnings alone doesn't tell you if the company has borrowed to achieve those earnings. However, one doesn’t need to have accounting basic to go through the balance sheet, just make it a simple one.
Net borrowing, MYR'000
-
-
-
-
Cash on hand, MYR'000
66,577
72,989
83,700
89,749
Debt ratio
46.63%
43.42%
41.34%
45.59%
ECS has no borrowing at all for the past four years and it has MYR90m cash on hand! It is very healthy in term of financial condition.

5. Who Runs the Company?

This is one of the main things that we need to look into. Management qualities reflect positively on the company's stability. Any company will have a website that lists the management team, how long they have been with the company and their background. Or, it can be found in annual report as well.
It needs to beware when someone takes over the decision maker position, especially from father to son.

Foo Sen Chin (“Foo”)
Executive Chairman
Age: 67
  • Bachelor of Science degree in Electrical and Electronic Engineering from the University of Birmingham, United Kingdom;
  • Master’s degree in Business Administration from the Cranfield School of Management in the United Kingdom

Soong Jan Hsung (“Soong”)
Executive Director / Chief Executive Officer
Age: 51
  • Bachelor of Science (Honours) majoring in Mathematics from the University of Malaya
Mr. Foo is the founder of the ECS while Mr. Soong began his career in ECS two years after ECS’s commencement of business. Both of them have 30 and 28 years experience in this field. They contributed significantly to the Group from non listing to listing and maximized shareholders’ wealth by improving ECS revenue and profit.  The company performance itself is the best indicator to reflect the management quality.

6. What Are the Company’s Risk Factors and Catalyst in Current Economy?

Implementation of GST
GST was implemented in Malaysia on 1st of April, to replace the zero per cent under the Sales and Service Tax regime. Definitely, there will be an initial slowdown in ICT sector due to the market's reaction to the GST. The expected impact is likely to be an overall slowdown in consumer sentiment and ICT spending, most notably in the consumer retail segment.

Smaller companies, particularly small and medium enterprises, will be more affected by the GST with most delaying their ICT investments for now. I expect ECS second and third quarter performance will be slightly moved down.  

Depreciation of MYR
MYR had depreciated 30% since last year until now.
USD1 = MYR3.30 as at 1st September 2014
USD = MYR4.30 as at 10th September 2015

ECS was purchasing its ICT products from its global brands ICT principals, where all of them are from foreign country. That’s mean ECS was purchasing using foreign currency and selling to third party using domestic currency.
As above statement, approximately 33.8% of purchases are priced in USD. Theoretically, strengthen of USD against MYR by 10% will reduce net profit by MYR2.5m! The management just hedge part of its exposure only.

In term of good catalyst, I don’t see any so far besides than its excellent financial result. There is no merger and acquisition or expansion. However, this year is ECS 30th anniversary. There might be a possibility that ECS will declare special dividend or bonus issue!

7. Is The Company Cheap In Term of Price?

A good fundamental company doesn’t mean it is cheap. For example, you saw a very nice NIKE shoes but it costs MYR1k, will you still consider?

As at 11st September 2015,
Price: MYR1.42
Outstanding shares: 180,000,000
Market capitalization: MYR255.60 million
52 week range: 1.02 – 1.83
P/E: 7.43
D/Y: 4.23%
ROE: 14.58%
NTA: MYR1.31

Based on above parameter, ECS’s PE is very low and its D/Y is attractive.

ECS’s FY14 net profit was MYR29.43 million. By using CAGR of 7%, ECS is expected to achieve a net profit of MYR31.49 million on FY15. It is equivalent to 17.5 cent earnings per share. By referring to the table below, obviously it is achievable. With a PE ratio of 10-11, ECS will have a fair value of MYR1.75 – MYR1.93.  
Financial year
2014
2015
Q1
4,785
9,389
Q2
7,515
8,001
Q3
7,282

Q4
9,850

Total
29,432
17,390

It still has 20%+ room to move. So, I think it is still fairly cheap.

By answering the 7 questions above, I believe you will have your answer to decide whether to invest or not.  Of course, there is no right or wrong whether to pick or not, as everyone had their own method of investing. Find the company that suits your criteria the most.

Just for sharing.

Wednesday 16 September 2015

Case Study - Investors Or Speculator?

Shares market itself is a very sensitive place. No matter how the analysts and economists estimate the future trend, the winner will still be the market. The movement of market is depending on market sentiment and supply demand, which is actually unpredictable. This is also the uniqueness of the share market.

Indeed, the market itself is not a rational place. It might not have a reason behind why it suddenly moves up and why it suddenly moves down. As an investor, the only things we can do are to look through the whole picture and pick stocks based on its catalyst, fundamental.

However, no matter how bad the fundamental of a company is, as long as it had little bit related to current theme played by speculator, eventually it will still “digoreng” up. 

One of the examples was VSOLAR. It went from MYR0.15 to MYR0.35 in two months time, which is equivalent to 133% return. The highest it reached before was MYR0.45.  

Obviously, the uptrend is not supported by its revenue and profit or any improvement. VSOLAR is a loss making company which it had made losses for more than 32 quarters continuously!

So, what is the reason behind the VSOLAR bull trend from Dec 14 to Mar 15?

VSOLAR is principally an investment holding company as well as renewable energy, media publishing, software solutions and production house.

If I am not mistaken, speculators related the theme of “Solar” and “GST software” with VSOLAR during beginning of the year 2015. They took this opportunity to lift up VSOLAR. When the price is going up without the support of its revenue and profit, it is just like a timing bomb and the speculators are holding the bomb and passing to each other. When the bomb times up, it is time to say goodbye to the unlucky one. The market maker took profit and disposed all their VSOLAR shares when they had satisfied with the amount. VSOLAR dropped from MYR0.35 and back to its original value. Now, it is only MYR0.085 which is lower than its previous price before it “digoreng” up.

The saddest thing is I still saw some people commented that they had averaged down by collecting more. I can’t imagine how their investment on VSOLAR is right now. Indeed, it is nothing difference with gambling! 
Another example is K1. Since the crude oil crisis on Dec 2014, K1 started to move up again from the price of MYR0.35. It took 5 months to reach MYR0.65, which is equivalent to 86% return. 

Based on its quarter report before FY15, it is profit making company with consistent earning. So, it is reasonable why its price moves up slowly.

However, after FY15Q1 report out, K1’s earnings dropped more than 70%! Subsequently, the next two day, it dropped to MYR0.305. It only took 2 days to drop 51%! Even until now, K1 are still not coming back yet. I believe one of the reasons is fear and it caused most investor no longer interest in K1.

If based on K1 fundamental, I am very sure theoretically this should not be happen, at least it is still profit making. But, this is shares market. I believe there are some market makers behind this. Coincidently, K1 quarter earnings dropped significantly. So, they took this chance to dispose everything and it caused fear among the investors.  Of course, this is just my thought, I might be wrong too.

However, if you are an investor and had some knowledge in shares, you might not fall into this.

1st support line was set when the price breakout. The support had been shifted up to 2nd line once it breakout to a new region. Subsequently, we moved the support to 3rd line followed by another breakout. The concept is very simple, once the price retested the support line few times and eventually dropped below the support line, it means that it is time for us to take profit. Besides that, the shooting had been formed at the top. So, it is also another signal that the trend had started to change.

I believe the reversal of trend most probably caused by insider news. There will be some employees or friends who know the first hand news that K1 quarter earnings drop significantly. So, they disposed of their shares first before the report released.

Let’s say even though you fail to sell it before the report released. But, at least you will still sell it once you saw the report because it’s a change in K1 fundamental.

In addition, it is a very long bear engulfing candlestick. At least, you will not trying to average down by collecting again. So, this is why I am trying to emphasize that investment knowledge is important!

This is one of the case study which I tried to bring out the message of importance of knowledge. After every fail investment, we need to sort out what the reason is and what’s wrong with our strategy. Learn from every mistake. I believe it will help us to improve and gain more experience.   

As a conclusion, in order to success in shares investment, we should acquire ourselves with knowledge.  Always remember that 80% of people lose money and only 20% win money in shares market. So, which one you want to be? A speculator or an investor?  Start from today, invest in yourself rather than continue paying fees to the market. The best investment you can make is in yourself.

Just for sharing.

Tuesday 15 September 2015

Net Current Asset Approach - Yay or Nay?

There are many approaches that we can use to select a stock. NCAV is one of it. 

Net current assets value (“NCAV”) is calculated by taking a company's current assets and subtracting the total liabilities, and then dividing the result by the total number of shares outstanding.

According to Graham, investors will benefit greatly if they invest in companies where the stock prices are no more than 67% of their NCAV per share. He also mentioned that any companies selling below their NCAV values carry lower risk: “They are worth considerably more than they are selling for, and there is a reasonably good chance that this greater worth will sooner or later reflect itself in the market price. At their low price these bargain stocks actually enjoy a high degree of safety, meaning by safety a relatively small risk of principal.”

FACB Industries Incorporated Berhad is one of the examples.
  • Wholesales dealership and retailing of mattresses, furniture and related accessories
  • Manufacturing and sale of stainless steel butt-weld fittings
Current price = MYR0.965
Net tangible assets (“NTA”) = MYR2.45
Net current assets value (“NCAV”) = MYR2.06
FACB current price is only 46.8% of its NCAV now. The main current asset of FACB is its MYR150m cash on hand with zero borrowing/debt!
After the bullish trend on end of 2012 due to disposal of loss making subsidiary at China, FACB breakout from the level of MYR0.60 and moved in the price range of MYR1.00-1.60. The highest it reached before was MYR1.65. However, now it back to the level of below MYR1.00.

Malaysia famous investor, Cold Eye (冷眼) had mentioned about this company in his book too. He also related it to cash rich, high NTA and NCAV. If I am not mistaken, he holds FACB since few years ago until now. However, based on the chart, if you bought in at the beginning of 2013 and hold until now, you will face losses in term of price appreciation. In other words, you wasted three years of your time by getting nothing. 
In term of its financial results, FACB’s net profit started to be stable since second quarter of FY15.

The below is the statement which I extracted out from its latest financial report.
“The bedding operations in Malaysia recorded better profit before tax mainly due to improved gross profit margin despite a 20% reduction in revenue. The stainless steel fitting operation posted a reduced loss before tax due to improvement in selling price and gross profit margin. Higher profit contribution was recorded by associates in the business of power generation.”

I had not much comment on that. However, if you compared its net profit with its assets, you will found that its Return on Asset (“ROA”) is only 2% for the whole FY15! FACB is a very cash rich company since the disposal of subsidiary since end of 2013. It had been almost 2 years and yet its management doesn’t make use of their cash wisely, either to expand the company business or acquisition of other potential company. FYI, FACB is a beneficiary of weakening of MYR. It is not affected by low commodity or crude oil price too.

Even though FACB had MYR150m cash on hand, they also did not declare any special dividend after the disposal. The dividend they declared is one year lesser than one year. They rather keep the cash in their bank.
Financial Year EndedDividend per share (cent)
FY20152.50
FY20142.80
FY20133.20
Most investors tend to say that by using MYR1+ per share, they can purchase a company with NCAV up to MYR2+ per share. But for me, no matter how rich a company is, as long as they do not use its cash to generate more profit or unlock its value, it is still meaningless. In every comprehensive income, there is a “profit attributable to owners of the company”. It is the part which belongs to investors. It also reflects the quality of management and how well they maximize the value of shareholders.  

For example, what will you do if you have MYR150m cash on hand? Some will invest in shares market, some will establish a new business, and some will buy a new property. There are many ways to use this cash wisely in order to grow your money. However, if you do nothing and save it in bank, you will only get bank interest by the end of every year. It is true that you will not have any risk but at the same time the return you get will be very low.  

With no doubt, in term of financial, FACB is very health. However, in term of profitability, it is not. I agree that the risk of investing in FACB is much lower compared to others because of its high NCAV, as it definitely able to survive through financial crisis if any, with this huge amount of cash. But, if you aim for higher return, FACB is surely not suitable for you.
As a conclusion, there is no right or wrong in every approaches. Before I end this, for those who mainly use NCAV approach for stock selection, here is a list of stocks for your reference.  

STOCKSNCAV
KESM          2.80
Magni          1.37
SHL          1.35
Lii Hen          1.28
UPA          1.26
ECS          1.22
Ulicorp          1.05
Latitude          0.95
Oriental Food          0.95
Favco          0.93
Focus Lumber          0.89
Y.S.P Southeast Asia          0.88
Fututech          0.83
IQ Group          0.82
Matrix          0.79
SCC          0.66
Mitrajaya          0.63
Vitrox          0.58
KKB          0.53
HSL          0.52
SCGM          0.52
Turbo          0.51
Sycal          0.49
LTKM          0.39
Classic Scenic          0.38
Signature          0.37
Willowglen          0.35
Prolexus          0.35
LCTH          0.30
Superlon          0.29
CCM Duopharma          0.28
Uchitec          0.28
Homeritz          0.22
SLP Resources          0.19
Tambun          0.18
Wellcall          0.16
Scicom          0.16
Ken          0.13
SKP Resources          0.13
Penta          0.13
Elsoft          0.12
Hup Seng          0.11
Boilermech          0.11
Excel Force MSC          0.08
Mikro MSC          0.07

Just for sharing.


Monday 7 September 2015

Index Warrant - Warrant Terms

Before you choose an index warrant you should first look at the nature and performance of the INDEX FUTURES and take a view. If you think the index futures is going to go up, buy a call index warrant. If you are bearish, buy a put index warrant.

FYI, today FBMKLCI closed -6.31 points. However, most of the put warrants did badly. HW dropped 13.68%, HV dropped 14.89% and HK dropped 13.04%! So, what is the reason behind? Again, I want to emphasize that price of index warrant is not affected by index itself, it depends on index futures.

You may refer my previous post for more information.


During market closed today, FBMKLCI futures (Sep 2015) was breakeven at the level of 1,560. It lowest level is 1,538.50 while highest level is 1,564.50. This is the reason why most of the index warrants were once at a very high price today.

After the market closed today, FBMKLCI futures dropped 1 point to 1,559. So, tomorrow the index warrant might open slightly higher than today closing price. 


Today, I would like to explain some warrant term by using FBMKLCI-C12 as illustration. If you notice the price changes today, you will wonder why this index call warrants performed better compared to others. Why its volume is so huge?


Exercise ratio
Current Price
Exercise Level
Expiry Date
 Cash Settlement Amount
Breakeven Level
Gearing Ratio
Delta
Effective Gearing Ratio
700 : 1
0.185
1,520
31-Mar-16
0.06
1,649.50
12.04
62.90%
7.57
Current FBMKLCI futures (Sep 2015) = 1,559.00

This is some of the information about FBMKLCI-C12. If you compared with others 26 call warrants, you will found that FBMKLCI-C12 is the only call warrant which is in-the-money. In-the-money means the current index futures level exceeded the exercise level of warrants and you will get back cash settlement amount by end of expiry date. Normally, in-the-money warrants are more able to attract investors.

Expiry date will be another concern. It is very important because as the expiry date of the index warrant is getting closer, the risk is getting higher. Until a certain period, let’s say 1.5 months to the expiry date, if the warrant is still out of money, people normally will not bid for this warrant anymore. At that time, you will not be able to sell off your warrant and end up become a valueless paper. You will loss all your capital in this investment. For example: FBMKLCI-CP and FBMKLCI-CO. As for FBMKLCI-C12, it still has 6 more months before it expired.

Effective gearing ratio is the best ratio to tell you the effective exposure. For FBMKLCI-C12, an effective gearing ratio of 7.57 times means a 1% movement in the futures translates into an approximate 7.57% movement in the warrant. The higher the effective gearing, the greater your exposure and the greater your potential returns. However, if the market goes against you, your losses will also be higher. Therefore, decide the level of gearing you are comfortable with.

Lastly will be the premium of an index warrant. To calculate the premium, you need find out the cash settlement and then compare with the index warrant price that you bought. The difference between cash settlement and your index warrant price is called premium. The cash settlement amount is calculated as below:


Example: FBMKLCI-C12
Cash settlement amount – MYR0.06
FBMKLCI-C1 price – MYR0.185
Difference = MYR0.125 / 67.57% premium

Generally, premiums are higher for longer-dated warrants. They are also higher for warrants with higher effective gearing levels.

Besides than this four, the factors that can take into consideration are delta, exercise ratio, warrant sensitivity and implied volatility. However, I am not going to talk further as it will be a long topic.

You may refer to https://www.malaysiawarrants.com.my/tools?sp=dwsearch for all the details of index warrants, including delta, gearing ratio, effective gearing ratio, etc.
Just for sharing.